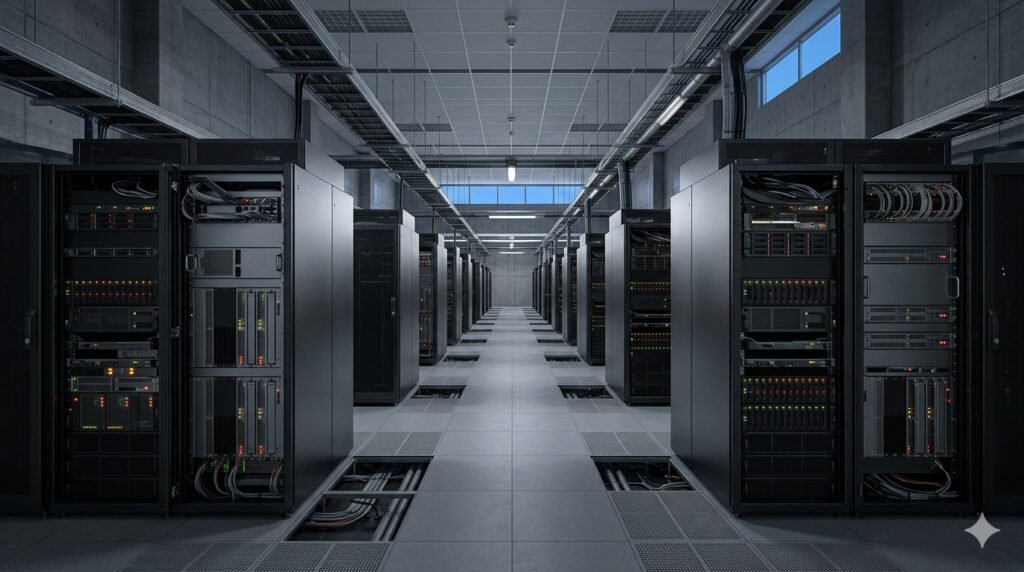
Blueprints for Cluster Telemetry and Spike Detection
The telemetry blueprint lays out the minimum data model, collection cadence, and enforcement points needed to detect and mitigate power spikes and thermal excursions across a GPU farm at scale. Operational teams require deterministic telemetry windows, not ad hoc sampling, to align power budget enforcement with rack-level PDUs and per-node thermal sensors.
Telemetry must capture synchronized, timestamped streams from GPU PMCs, IPMI, host OS power capping, and top-of-rack environmental sensors at sub-second granularity where possible. Architectures that rely on 5–10 second aggregation windows miss transient power spikes that trigger rolling throttles, which increases job failure rates and cost overruns.
Predictive detection must combine high-frequency telemetry with short-term models running at the edge to pre-empt grid-level reactions and on-premise breakers. The data suggests that a hybrid streaming pipeline, with in-node pre-aggregation and cluster-level correlation, reduces false positives and maintains QoS under aggressive SLAs.
Data Model and Sampling Cadence
Design a canonical telemetry schema mapping GPU counters, VRM currents, chassis inlet temperatures, and rack PDU feed phases to a single timeline. Consistent metric naming and units across vendors prevents misalignment; use SI units and UTC timestamps, and enforce sampling jitter limits to keep correlation windows tight.
Sampling cadence must balance resolution with network load: 250–500ms for GPU power telemetry and 1s for chassis and rack sensors is a practical starting point for most production-scale clusters. Architectural reality requires adaptive sampling, elevating cadence during workload ramps and reducing it during stable windows to manage ingest costs.
Edge aggregation within the server or an appliance reduces east-west noise and shields the control plane from the raw telemetry torrent. Implement backpressure and graceful degradation policies so that dropped high-frequency samples do not erase cross-node correlation keys needed for post-mortem analysis.
Inference and Detection Layers
Real-time inference must live in two places: lightweight heuristics at the edge and more computationally intensive correlation and causal models centrally. Fast local rules trigger immediate power caps, while central models provide context, determining whether a spike is a workload signature or hardware fault.
Detection algorithms should include anomaly scores, short-window deltas, and cross-node correlation graphs to identify coordinated spikes that indicate network or scheduler-induced bursts. The detection stack must support explainable outputs to feed operator runbooks and automated remediation.
Remediation actions must be ranked by impact and reversibility, from soft frequency capping to job migration, preserving throughput when possible. The remediation policy engine should be policy-as-code, auditable, and tied to billing and job priority metadata.
The following briefing synthesizes telemetry architecture, operational controls, and financial modeling required for CTOs and infrastructure leaders managing massive GPU clusters. It ties silicon-level constraints, facility power realities, and modern telemetry fabrics into decision-ready tactics for 2026 enterprise deployments.
Architectural Telemetry Stack and Data Pipeline
A resilient telemetry stack streams normalized metrics, correlates events, and exposes control APIs that tie into schedulers and PDUs for automated mitigation. Enterprises need a low-latency ingestion layer, a nearline enrichment tier, and a long-term store optimized for OLAP queries and forensic retrieval.
The ingestion layer must support high-throughput protocols such as gNMI, gRPC streaming, and Kafka with compression and schema registry, peaking at tens of GB/s for hyperscale deployments. Use time-series stores with write-optimized storage for hot windows and columnar stores for historical analysis to balance cost and query performance.
Topology-aware routing improves correlation and reduces cross-rack noise, by tagging telemetry with network path and power domain metadata at collection time. Implement deterministic sharding aligned to racks and PDUs to speed causality analysis during incidents.
Telemetry Feature Scorecard
Map feature priorities to operational outcomes using a compact scorecard that informs procurement and integration choices. This assists architecture committees in vendor tradeoffs and service-level costing.
Telemetry Feature Scorecard:
| Feature | Impact on Detection | Cost Impact | Implementation Risk |
|---|---|---|---|
| Sub-second GPU power sampling | High | Medium | Medium |
| Rack PDU phase monitoring | High | Low | Low |
| Edge aggregation appliance | Medium | Medium | Medium |
| Schema registry and gRPC | High | Low | Low |
| Long-term columnar archive | Low | Medium | Low |
Ingest, Enrichment, and Storage Patterns
Prioritize deterministic ingest windows with bounded latency guarantees and observability for the pipeline itself. Implement SLOs for ingestion latency, enrichment lag, and query time, because operational decisions depend on predictable timings rather than best-effort telemetry.
Enrichment steps add topology, job metadata, and energy pricing signals to raw metrics to enable cost-aware remediation decisions. Separate the control loop data path from bulk historical writes to avoid tail latencies affecting real-time control.
Retention tiers must reflect forensic needs and chargeback models, keeping high-resolution telemetry for 7–30 days and downsampled aggregates for longer-term trend analysis. Volume estimates should include compression ratios and expected cardinality from job and node labels.
Real-Time Thermal Throttling and Power Guardrails
Thermal throttling occurs when thermal gradients or VRM limits push GPUs into power-limited modes, and guardrails need to prevent cascading capacity loss across a cluster. Enterprises must manage both immediate thermal risk and the secondary effects on scheduling, SLAs, and energy cost.
Detect thermal throttling by correlating GPU power draw, clock frequencies, and thermal diode readings within sub-second windows. Use control feedback that includes both automatic hardware thermal governors and external power capping to avoid job-wide performance cliffs.
Power guardrails should operate across multiple domains: per-GPU, per-server, per-rack, and facility. Enforcement must be hierarchical and policy-driven, with overrides tied to job priority and business impact assessments.
Hardware Interaction and Control Paths
Integrate with vendor telemetry and control interfaces such as NVIDIA MIG monitoring, BMC/IPMI for chassis sensors, and vendor PDU APIs for rack-level control. Direct PMBus access to VRMs provides the fastest feedback but requires careful security and concurrency controls.
Control flows must avoid oscillation: introduce hysteresis, rate-limited adjustments, and predictive ramps based on short-term workload forecasts. The safest default is to steer jobs before thermal limits are hit, not merely react when throttling begins.
Auditability and traceability of control actions matter for FinOps and compliance: log every cap, migration, and throttle event with causal telemetry slices and cost implications. These logs feed governance and chargeback systems.
Scheduler Integration and Policy Enforcement
Schedulers must be telemetry-aware and capable of enforcing soft and hard constraints based on real-time signals. Policy decisions include job throttling, virtual device scaling, or migration to cooler racks when feasible.
Implement admission control that factors current thermal headroom, upcoming energy pricing windows, and SLA priority to accept new jobs or delay them. This prevents over-commitment and reduces preemptive throttling that impacts completion rates.
Automate policy-as-code tied to telemetry thresholds, and maintain a simulation sandbox to model policy impacts on throughput and cost. The data shows that conservative policies with controlled preemption reduce time-to-completion variance for high-priority workloads.
Operational Runbooks and Incident Response
Operational runbooks must convert telemetry triggers into precise actions, with playbooks for common failure modes such as coordinated power spikes, stuck fans, or VRM degradation. Runbooks must be terse, executable, and linked to live telemetry slices.
Create tiered incident definitions that map metric patterns to severity and remediation scope, enabling automated mitigations at low severity and human escalation only when thresholds indicate hardware failure. This reduces mean time to resolution while keeping engineers focused on true root causes.
Post-incident forensics require deterministic slicing capabilities: capture the N-second window before and after every throttle, include job metadata, and preserve raw high-resolution telemetry to allow failure-mode classification. These artifacts feed procurement and design improvements.
Automated Playbooks and Human Escalation
Design automated playbooks that execute safe, reversible steps first, such as soft frequency caps or workload pausing, before proceeding to migrations or hardware shutdown. Each automated step must include rollback logic and an operator-facing rationale.
Escalation criteria should include persistent anomaly scores, repeated corrective actions, and cross-node correlation that suggests systemic failure. Route detailed evidence, not just alerts, to on-call engineers to reduce cognitive friction during incidents.
Train operations teams with regular simulated incidents that exercise the full telemetry and control chain, measuring response times and decision accuracy. The training should also validate that automated playbooks behave as intended across vendor mixes.
Post-Incident Analysis and Continuous Improvement
Use incident artifacts to refine detection thresholds and to tune predictive models for power and thermal behavior. Correlate incidents with hardware age, firmware versions, and workload patterns to find actionable procurement or firmware update policies.
Maintain a rolling three-month engineering backlog derived from incidents, prioritized by customer impact and cost avoidance. Track remediation success rates and input them into vendor negotiations and capacity planning exercises.
Feed improvement metrics back into the telemetry scorecard to close the loop between operations and architecture.
Financial and Energy Cost Modeling
Energy and cooling represent a significant portion of operating expense for GPU farms, and models must connect telemetry events to billable impact. Chargeback requires per-job accounting for energy consumption and SLA-driven priority costs during throttles.
Model the cost of a spike as the immediate kWh delta multiplied by marginal energy price, plus the opportunity cost from reduced throughput and migration overhead. For wholesale or dynamic pricing scenarios, couple telemetry with price signals to prioritize workloads in low-price windows.
Forecasting should include failure risk premiums for older hardware and the probability-weighted cost of throttling under current policies. Present these as deterministic line items in capital and operational budgeting.
Pricing Signals and Demand Response
Integrate real-time utility pricing and demand response signals into the scheduler and policy engine to opportunistically shift workloads. For critical workloads, lock policy overrides that prevent forced migration during price spikes but increase chargeback.
Design contracts with utilities that consider predictable consumption from GPU farms, negotiating curtailable demand clauses tied to automated throttling capabilities. This turns telemetry into a negotiating lever for lower rates.
Quantify savings scenarios with clear assumptions about elasticity, migration costs, and job sensitivity to latency. Use conservative baselines to avoid overpromising cost reductions.
Procurement and Lifecycle Costing
Specify telemetry and control requirements in RFPs to ensure new hardware supports the required sampling cadence and control APIs. Include failure-mode telemetry as a procurement criterion to reduce the cost of undiagnosable incidents.
Lifecycle costing must include telemetry storage, compute for inference, and expected mitigation costs. Allocate a portion of the capital budget to telemetry appliances and edge compute to preserve cluster throughput and reduce operational losses.
Report procurement tradeoffs as TCO delta per teraflop-year, including expected savings from reduced throttling events.
Compliance and Multi-Tenant Isolation
Telemetry contains sensitive operational and workload metadata, creating privacy and tenancy isolation challenges in shared clusters. Design data access policies and physical segmentation to prevent tenant leakage and to comply with data residency obligations.
Implement role-based access, cryptographic separation of tenant labels, and query-level anonymization for aggregated dashboards. Ensure that remediation actions that move or throttle jobs do not expose tenant behavior patterns to other tenants.
Audit telemetry access and control actions to satisfy compliance frameworks and internal governance. Retain logs with retention policies aligned to legal and contractual requirements.
Multi-Tenant Policy Enforcement
Enforce tenant-specific power and thermal limits and reflect them in admission control and scheduler decisions. Allow tenants to opt into higher resilience tiers at higher cost or accept lower priority in constrained windows, with clear SLAs.
Design tenant isolation for both data and control planes, ensuring that tenant-triggered telemetry cannot execute control actions outside their scope. Use signed capability tokens for any action that affects resource allocation.
Monitor for noisy neighbor patterns and automate rebalancing to limit cross-tenant thermal impacts without manual intervention.
Security and Data Governance
Harden telemetry endpoints and pipelines to prevent tampering that could hide spikes or falsely trigger throttles. Use mutually authenticated channels, signed telemetry, and a secure enclave for critical control decisions.
Apply retention and redaction rules to telemetry exports and third-party analytics, ensuring that exported datasets remove tenant identifiers unless explicitly authorized. Maintain an incidents register for telemetry-related security events.
Periodic compliance audits should verify that telemetry policies align with contractual requirements and with evolving data protection standards.
FAQ
Telemetry in high-frequency environments demands a distinct operational posture that integrates monitoring, enforcement, and financial modeling. The FAQ below addresses advanced edge cases and hardware failure scenarios that infrastructure leaders face.
How do you distinguish workload-driven coordinated spikes from a failing PDU phase?
Correlate node-level phase currents with job placement and network activity in a short-window model, and look for phase imbalance signatures across the rack. A failing PDU phase yields consistent imbalance across passive workloads, while workload-driven spikes correlate with job start times and GPU utilization deltas within milliseconds.
What is the safest way to automate GPU frequency capping without destabilizing jobs?
Rate-limit frequency changes with hysteresis and couple caps to predictive short-window models that forecast thermal headroom for the next 30–120 seconds. Validate automated caps in a canary pool, and include operator-visible rollback triggers to reverse caps if job-level QoS degrades unexpectedly.
How should telemetry handle firmware-induced metric discontinuities during upgrades?
Tag telemetry streams with firmware and driver versions and maintain parallel comparison baselines to detect metric drift. Use shadowed validation windows during upgrades to prevent sudden policy changes; treat versioned anomalies as a temporary elevated-severity incident until baselines normalize.
What is the recovery strategy for a coordinated thermal event that spreads across racks?
Isolate affected racks via tiered power throttles and migrate priority workloads to pre-warmed cooler racks, balancing migration cost against SLA breach risk. Execute containment first, then forensic capture of pre- and post-event telemetry to identify root cause and prevent recurrence.
How do you model the economic impact of transient spikes on FinOps chargeback?
Combine high-resolution energy delta during the spike with job-level runtime impact and the marginal energy price, then add migration or reacquisition costs. Present results as expected cost per thousand GPU-hours with sensitivity bands for price volatility and spike frequency.
Conclusion: Cluster Telemetry Blueprints: Real-Time Monitoring of Power Spikes and Thermal Throttling in Massive GPU Farms
The strategic imperative is clear: telemetry must function as both sensor and governance plane, enabling predictable performance, lower operational risk, and accountable cost allocation. Integrate high-resolution telemetry with policy-as-code and scheduler-aware enforcement to prevent transient spikes from becoming systemic outages.
Operationally, invest in edge aggregation, sub-second sampling for GPU power, and topology-aware ingest to maintain causality and fast remediation. Financially, tie telemetry to price signals and chargeback, and quantify the marginal cost of spikes to inform procurement and demand response contracts.
Technical forecast for the next 12 months: expect accelerated adoption of hardware vendors supporting sub-second PMU exports, tighter integration between schedulers and telemetry policy engines, and increased utility contracts that value automated curtailable load. Architectures that combine predictive edge inference with centralized, auditable policy control will show the best combination of throughput stability and cost efficiency.
Tags: cluster-telemetry, GPU-farm, thermal-throttling, power-management, high-performance-infrastructure, telemetry-pipeline, FinOps