Visualizing petabyte-scale scientific datasets requires an operational bridge between high-performance compute, distributed storage, and responsive rendering. As Grid Computing evolved into modern distributed systems that include cloud, edge, and AI accelerators, visualization pipelines must adapt to heterogeneous infrastructure and new I/O realities. This paper presents practical strategies, architectural comparisons, and an implementable roadmap for visual analytics at petabyte scale.
The goal here is to ground recommendations in engineering constraints: network topology, storage performance, compute acceleration, and human factors such as interactivity and reproducibility. I write from the perspective of a senior infrastructure architect who has led multiple transitions from batch-oriented grid systems to mixed cloud and edge deployments. Readers will find concise guidance on design choices and trade-offs that matter in production.
I assume familiarity with core concepts: parallel file systems, object storage, RDMA, GPUs, and container orchestration. Where specific tools appear, I highlight their operational role rather than endorse a single vendor. The focus remains on measurable metrics – throughput, latency, concurrency, cost per terabyte – and on patterns that scale from tens to thousands of nodes.
Evolution from Grid Computing to Modern Distributed Systems
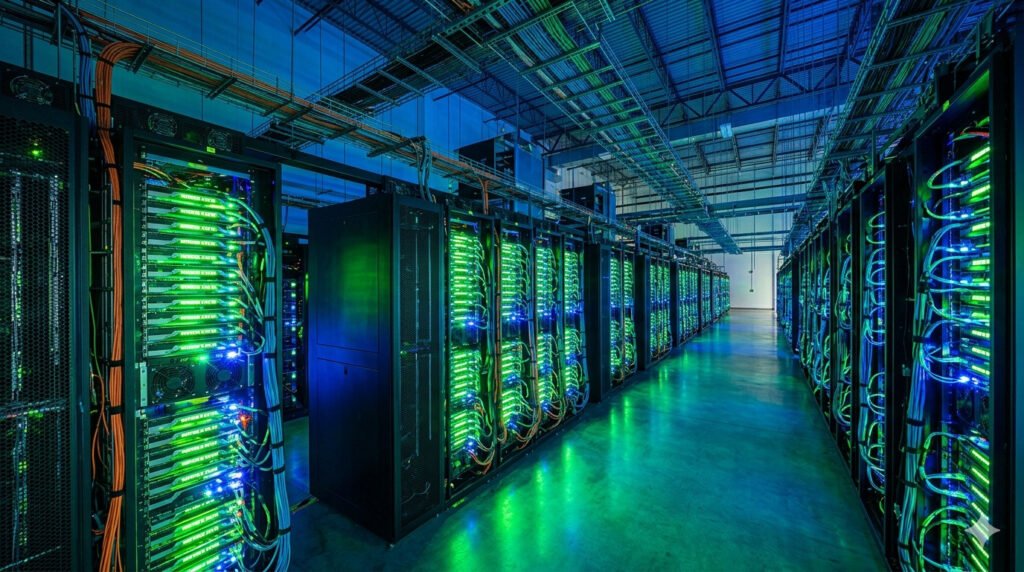
Grid computing solved a particular set of problems: federated resource sharing, scheduler-driven batch jobs, and standardized middleware for HPC centers. Those primitives remain valuable, but data volumes have outgrown tape-and-burst workflows. Modern systems replace heavy centralization with layered storage and compute tiers that align with dataset size and access patterns.
Cloud object stores introduced operational elasticity and simple durability models that changed the economics of storing petabytes. Edge nodes add low-latency aggregation points for distributed instruments and sensors. AI accelerators give us the ability to preprocess and compress data in place, reducing the downstream visualization load. This combination requires orchestration that balances cost, latency, and throughput.
Practically, teams must re-evaluate data placement, access patterns, and security models. Where grid systems emphasized scheduled runs, modern pipelines adopt streaming, progressive refinement, and in-situ analysis to reduce movement. The architecture should let you push compute to data when feasible and use network-efficient representations when not.
Challenges in Visualizing Petabyte-Scale Data
The first technical barrier is I/O – reading petabytes into memory is not practical. High sustained throughput from storage to render nodes requires parallelized access, locality-aware scheduling, and careful use of caches. Single-client bottlenecks and metadata contention in object stores degrade interactive performance quickly.
Rendering itself can stress both memory and GPU resources. Full fidelity visualization for petabyte inputs often demands level-of-detail schemes, multi-resolution pyramids, or compute-driven sampling so that a human can explore meaningful structure without waiting hours for a frame. Latency sensitivity varies by use case; exploratory analysis needs sub-second feedback while batch renderings tolerate minutes.
Operational complexity grows with scale. You must monitor and tune network fabrics, configure storage for targeted read patterns, and manage software versions across CPU and GPU nodes. Reproducibility also becomes harder as data sharding and on-the-fly compression change the numerical results unless carefully controlled.
Techniques and Tools for Scalable Visualization
Design visualization pipelines to move minimal data. Use data reduction techniques like feature extraction, statistical summaries, and compressed multi-resolution tiles. Zarr and TileDB provide chunking and axis-aligned access patterns that map well to scientific arrays; pair them with compression schemes that favor fast decompression like Zstandard.
Stream-first approaches reduce I/O peaks. In-situ visualization frameworks, for example ParaView Catalyst, let you generate derived products during simulation runs. For post-hoc analysis, progressive rendering systems and server-side tiling let clients request only the needed detail. Use GPU-accelerated libraries for ray tracing and volume rendering where latency matters.
On the orchestration side, Dask and Ray provide distributed compute for data preparation, while container orchestration handles placement and scaling. For web-based delivery, combine server-side rendering with WebGL clients and lightweight protocols that stream image tiles or compressed geometry. Always measure end-to-end latency from storage object to client render.
Infrastructure Roadmap for Visual Analytics
- Inventory and profile datasets – capture size, read patterns, and temporal access.
- Implement tiered storage – SSD cache, object store for bulk, and archival for cold data.
- Deploy chunked formats – adopt Zarr or TileDB with metadata strategies for partitioning.
- Add an in-situ layer – integrate visualization hooks into simulation or acquisition pipelines.
- Build a rendering tier – GPU-enabled nodes with remote rendering and image-streaming endpoints.
- Automate data pipelines – use orchestration for scheduled preprocessing and on-demand jobs.
- Monitor and tune – collect I/O, network, and GPU metrics and apply iterative tuning.
- Plan for capacity growth – adopt cost models and capacity thresholds tied to operational SLAs.
This roadmap sequences changes so teams deliver incremental value. Profiling first prevents wasted effort. Tiered storage and chunking deliver the largest immediate gains in interactivity. In-situ and rendering tiers require closer integration with compute workflows and should follow once baseline data handling is stable.
Budgeting and procurement should reflect the roadmap. Prioritize fast local cache and high-throughput networking early. Reserve cloud or burst capacity for short-term spikes rather than steady-state compute. Use metrics from the monitoring step to validate capacity assumptions before large purchases.
Operational Practices and Performance Engineering
Measure, do not guess. Use synthetic benchmarks that replicate your topology and access patterns. Track read amplification and metadata call rates for your chosen storage format. Look for hotspots where a small fraction of nodes handle most of the traffic and address them with better sharding or client-side prefetching.
Network tuning pays off. For 100 Gbps fabrics or InfiniBand, enable jumbo frames, tune TCP buffers when using Ethernet, and use RDMA for latency-sensitive paths. On the storage side, choose NVMe-backed caches for small random reads and tune object store multipart sizes for parallel reads. Balance concurrency to avoid saturating metadata services.
Operational playbooks should cover failure modes, reproducibility, and cost control. Automate snapshotting of chunked datasets, versioning of derived products, and reproducible container images for rendering stacks. Use quota policies to avoid runaway pre-processing jobs and track downstream storage growth driven by visual artifacts.
Comparison of Visualization Architectures
| Architecture | Strengths | Limitations |
|---|---|---|
| On-prem HPC cluster | Low-latency fabric, tight integration with simulations | High capital cost, limited elasticity |
| Cloud object storage + serverless compute | Elasticity, operational simplicity, pay-as-you-go | Egress cost, higher read latency for small random reads |
| Edge aggregation + cloud rendering | Low-latency regional access, reduced backbone transfers | Operational complexity, consistent management required |
Choosing an architecture depends on access patterns and budget. If users require interactive exploration of recent data, edge aggregation with local caching yields the best latency. If batch processing dominates, centralized cloud storage reduces admin overhead and supports elastic compute.
Hybrid architectures often provide the best trade-offs. Keep hot working sets on fast local storage, push bulk archives to object stores, and use cloud for burst rendering or machine learning assisted feature extraction. Ensure the architecture you choose exposes the necessary metrics to guide future adjustments.
FAQ
Q: How do I choose chunk size for Zarr or TileDB?
A: Base chunk size on the most common read window. Aim for chunks that yield 1-10 MB compressed read to balance throughput and parallelism. Test with representative queries and adjust for compression ratio and I/O concurrency.
Q: When should I use in-situ visualization versus post-processing?
A: Use in-situ when data movement cost or storage capacity is prohibitive, and when early feedback into simulations improves quality. Use post-processing for exploratory analysis that requires different parameter sweeps or when reproducibility of derived products is critical.
Q: What network fabric is recommended for petabyte visualization clusters?
A: Use low-latency, high-bandwidth fabrics such as 100GbE with tuned TCP settings or InfiniBand with RDMA for latency-sensitive components. For bulk transfers to/from cloud, ensure a high throughput path with dedicated links or direct connect services.
Q: How do I keep visualization results reproducible?
A: Version raw inputs, derived datasets, and container images. Record chunking, compression parameters, and random seeds. Store small metadata manifests with each visualization artifact to enable exact re-creation.
Conclusion – Strategies for Visualizing Petabyte-Scale Scientific Datasets
Visualizing petabyte-scale scientific data requires deliberate architecture choices that align storage, compute, and network investments with expected access patterns. By adopting chunked formats, tiered storage, and progressive rendering, teams can deliver interactive experiences without moving entire datasets. Operational engineering – profiling, tuning, and monitoring – will determine whether those designs meet production needs.
The transition from grid-era batch workflows to distributed systems that include edge, cloud, and AI accelerators opens new possibilities for in-situ processing and low-latency visualization. Implement the roadmap incrementally, measure impact, and allow metrics to drive procurement. With these practices, teams can turn petabyte datasets into actionable insight.